Models
This page is dedicated to the presentation of the intermediary models I worked and am working on within my Master Thesis.
Framework model 1
This model is finished, and its associated notebook can be found here.
It aims to set a first simplified version of the general framework I want to use.
In this context:
- health is binary (good or bad health status),
- weather is binary (normal state or deviation state),
- weather does not affect the probability of dying.
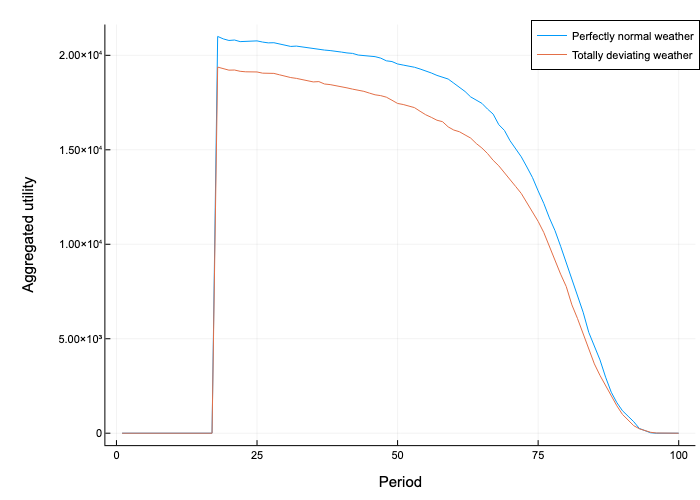
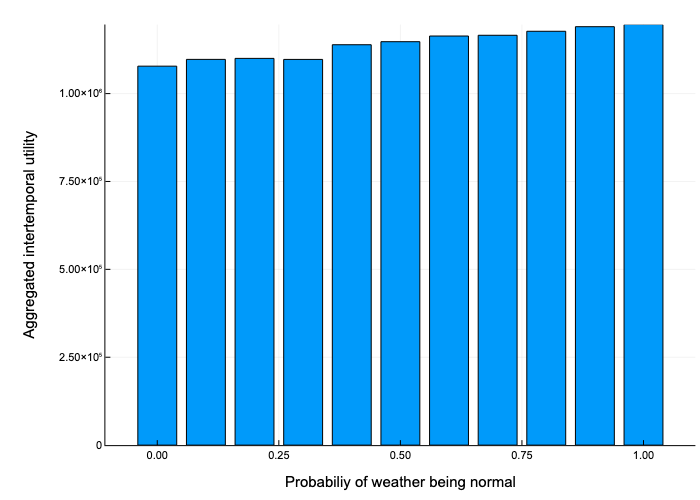
I manage to get a first idea of what my master thesis aims to look at, comparing societies with different probabilities of having a weather deviation state. The two main plots I manage to obtain are the following:
The first figure represents the aggregated utility of two societies, one in which there is no weather deviation at all (blue line), and the other where the weather is always in a deviation state (red line). Note that the general decreasing trend with period is due to the absence of individual reproduction in this model.
The second figure represents the different levels of aggregated intertemporal utilities in function of the probability of the weather being normal. We see what seems to be a linear relationship between the aggregated intertemporal utility and the probability of the weather being normal.
Framework model 2
This model is finished. Its associated notebook can be found here. It aims to add to the general framework a continuous variable for temperature.
In this context:
- health is binary (good or bad health status),
- weather is represented by a continuous temperature variable,
- the temperature affects the probability of being in a given health status, and survive, at the next period,
- the probabilities of health status and survival are of higher dimension,
- I tried implementing the first version of numerical method resolution.
To illustrate this model, two plots can be displayed here, corresponding to two functions of the model: - Productivity function - Survival function
Productivity function
The first one is about the productivity in function of the age and of temperature deviation. In this plot, we can see that there are two different surfaces. They correspond to the two different health status. If an agent goes from good health to bad health, they suffer a productivity shock, making them go from the higher surface to the lower one.
Survival function
The plot is about the final survival probability, which is function of several intermediary probability funtions. In this plot, we can see that there are two surfaces, that differ starting a certain age. Here again, the two surfaces correspond to two different health status. This is consistent is the data, that seems to indicate that individual with worse health type or worse health status have a higher death probability at a relatively advanced age, even if they are disadvantaged on other levels earlier on.
Framework model 3
This model is currently under constructin.
It changes the fonctional forms of the utility function, and try to solve numerically the model.
Visualisation
I am also working on some model visualisation. A notebook about it can be found here.

